Scott Townley
Bridgewater, NJ
Tetrode Calculations (Eimac EB-5 "Tube Performance Computor")
NX7U
This program automates most of the process involved in using the Eimac "Tube Performance Computor" and the Chaffee analysis it is based upon.
Sample Application
The main reason I wrote "Tetrode" was to be able to see how anode impedance (tuning and loading) affected the operating parameters of a tube. Doing this by hand with the EB-5 transparency was very slow, since you had to re-read the constant-current curves and re-interpolate all the points over and over again. It occurred to me that "digitizing" the constant-current curves once, and letting the computer do the interpolation (and while it's at it, the operating parameter) calculations would be much faster.
As in illustrative example, operating parameters for a 4CX1000A tube under various conditions are shown below.
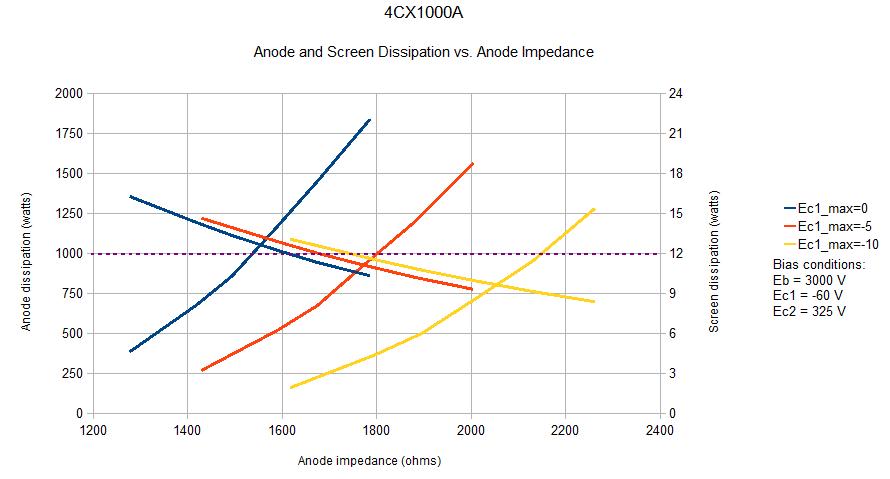
The chart above shows both anode and screen dissipation versus anode impedance for three levels of drive (Ec1_max). The horizontal magenta dotted line represents the maximum rated dissipation (1000 W for the anode, 12 W for the screen).
Some people say the 4CX1000A is a troublesome/problematic/crappy tube. I think I can see one reason why.
The 4CX1000A is rated for AB1 (no control grid current) service. The simplist approach is to drive the tube right to the point of control grid conduction, then back off the drive a bit. But look at the Ec1_max=0 (V) curves...there is no anode impedance where both anode and screen dissipation are kept under rated values! Even at Ec1_max=-5 (V) the range of "legal" anode impedances is remarkably narrow, about 1680-1800 ohms. I would imagine that just the process of getting the tuning and loading dialed in initially could be unpleasant for the tube.
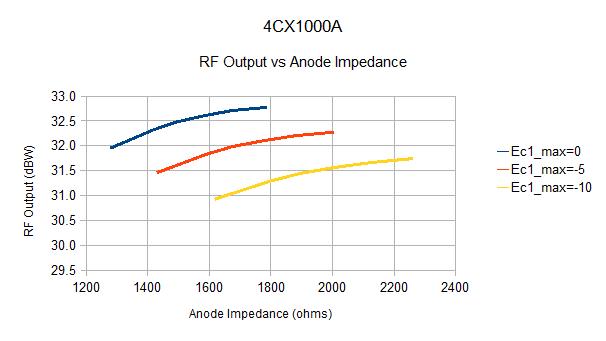
Another interesting result is that the output increases only about 0.7 dB for each 5 V increase in grid drive. It may be a reasonable compromise to select Ec1_max=-10 V to gain the wider anode impedance range, while trading off only a small amount of output power.
There's nothing particularly unique or special about the above example, but I found it instructive since I have many 4CX1000A tubes lying about. The curves were built from 18 separate runs of "tetrode". Using the EB-5/paper method would have taken much longer, with more opportunity for error in interpolating curves on the graphs. "Tetrode" allowed me to digitize the 4CX1000A constant-current plot once, and concentrate on playing with the parameters and results.
Figure 1. The steeper curves are Anode dissipation (use left-side axis) and the shallower curves are Screen dissipation (use right-side axis). For any given grid voltage (Ec1, color-coded as shown), the range of usable anode impedances is where both curves of a given Ec1 (color) are both below the dotted line.


